Measuring Emotional Engagement: Analyzing Viewers' Reactions with the Emotion Graph
Understanding how viewers emotionally respond to each moment in a video can be challenging. Our key feature, the Emotion Graph, provides a clear, frame-by-frame visualization of emotional shifts, allowing users to effectively assess and enhance the emotional impact of the content.
Gain Real-Time Insights into Your Viewers' Emotional Responses
Picture a clear, dynamic graph tracking audience emotions throughout your video. That's the Emotion Graph at work. Based on the Emotion Wheel, it displays core emotions like happiness, sadness, surprise, and relaxation in an easy-to-understand circular layout. As your video plays, a moving dot reveals the main emotion for each frame.
To illustrate the power of our emotion graph feature we can analyze the emotional flow of the popular YouTube video titled ”Happiness is Helping Others“.
In our emotion graph, you'll see:
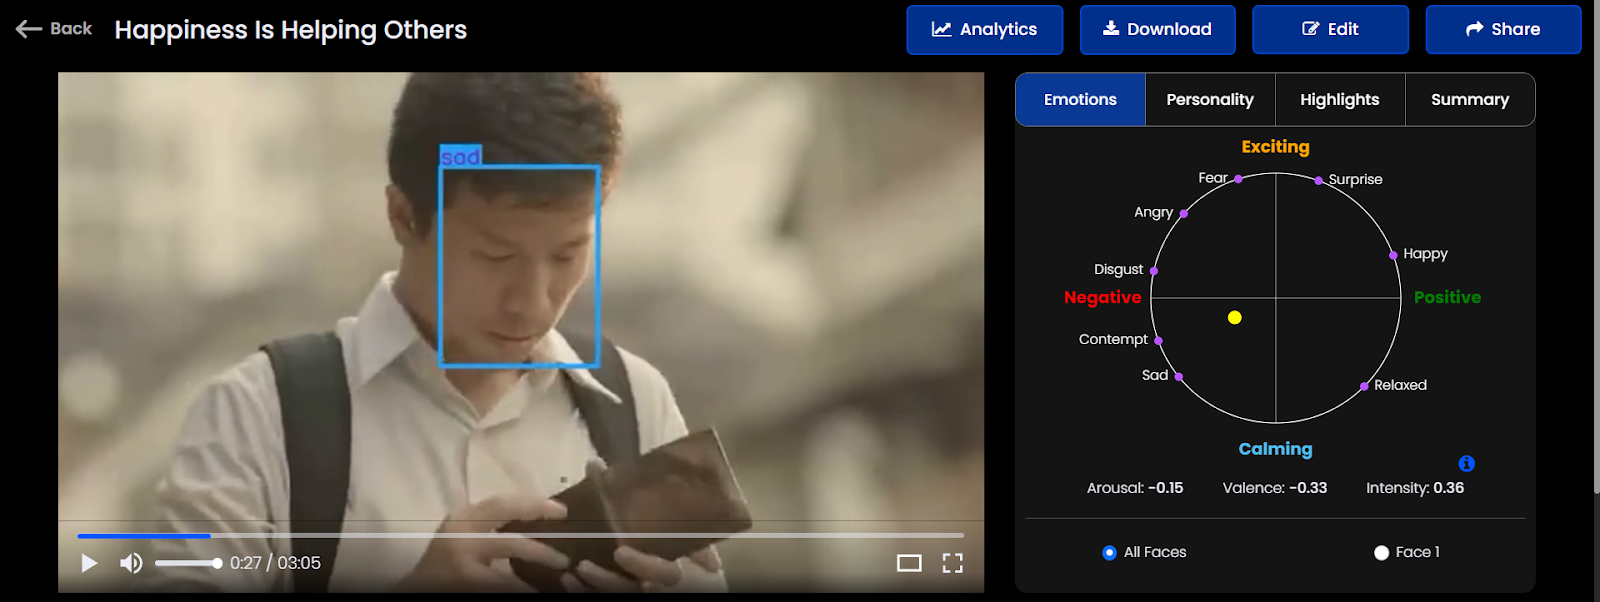
High Excitement Moment: When a person helps another and feels a surge of happiness from the act, the dot moves far from the center towards the happiness section, indicating a peak in positive emotional intensity.
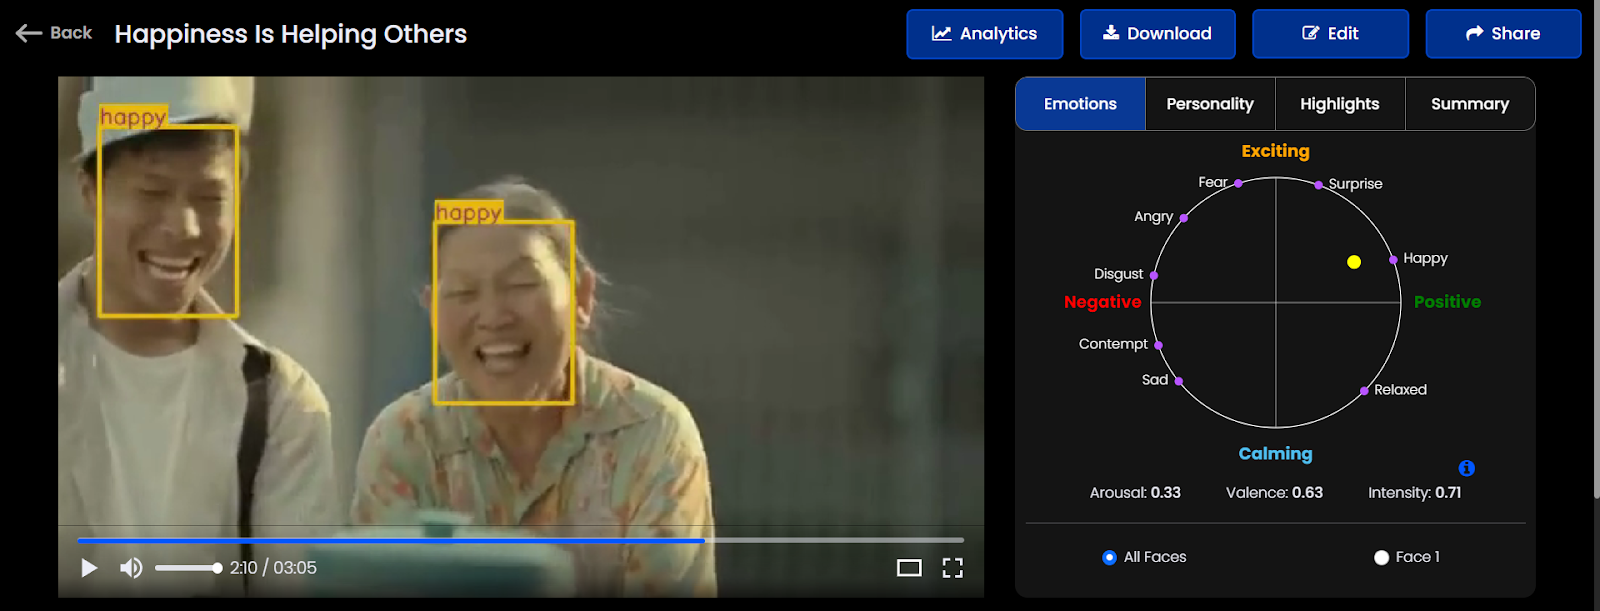
Neutral Moment: When the video transitions between scenes, showing everyday life without significant emotional cues, the dot hovers near the center, indicating a neutral reaction.
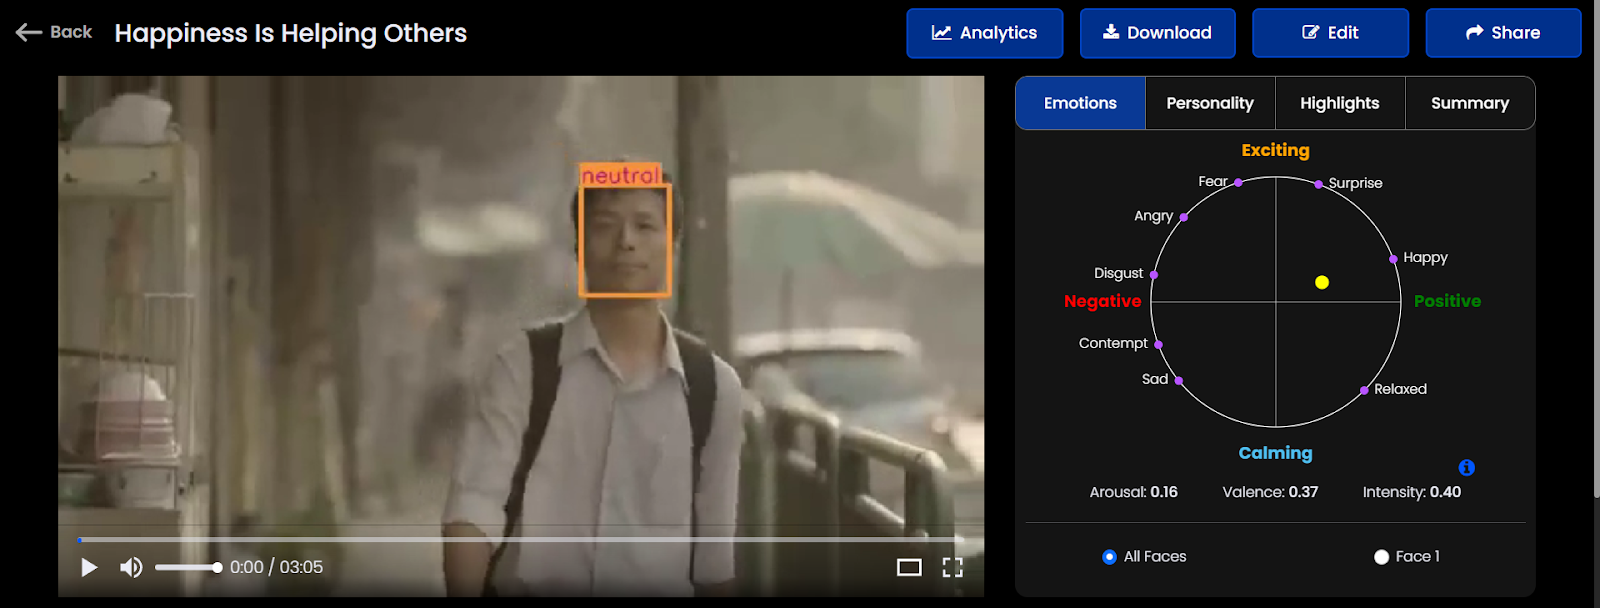
Sad Moment: During a part of the video where the person faces a setback and feels a significant drop in mood, the dot moves away from the center towards the sadness section, suggesting a subdued emotional response.
Digging Deeper: Capturing Nuanced Emotional Shifts
The Emotion Graph doesn't stop at the basics. It reveals subtle emotional changes viewers experience. You'll see how your content connects, identifying moments of surprise, joy, or disinterest. This detailed understanding helps you create powerful, engaging videos that stick with your audience.
Mapping the Emotional Trend
Imentiv AI’s Emotion Graph uses eight primary emotions - Fear, Surprise, Happy, Relaxed, Sad, Contempt, Disgust, and Angry - arranged around a circle. Each emotion sits on a spectrum - happiness is positive and exciting, while anger is negative and arousing. Surprise falls in between, and relaxation sits between positive and calming. This visual arrangement clearly shows how emotions flow and interact in your video, giving you a guide to your audience's feelings.
Applications Across Fields
The Emotion Graph helps professionals in various industries connect more deeply with their audience.
- Marketers: Create campaigns that trigger specific emotions and drive results.
- Psychologists: Get valuable insights into client behavior for more effective treatment.
- Content Creators: Develop content that resonates deeply, keeping viewers engaged.
- Researchers: Get precise, data-driven insights into emotional responses, providing a deeper understanding of human behavior.
The best part about the Emotion Graph? It's user-friendly! No technical expertise is needed, so anyone can tap into the power of emotional intelligence in their videos.
For a more in-depth understanding of the Emotion Wheel, please refer to our blog post:
Discover the Power of Emotions with the AI-Driven Emotion Wheel!