Emotion Graph by Imentiv AI: Visualizing Emotions Across Video, Audio, and Beyond
Human emotions are complex, layered, and often hidden beneath words or expressions. What if you could see emotions as they unfold, second by second?
That’s exactly what Imentiv AI’s Emotion Graph does. It transforms emotional cues from video, audio, and text into clear, interactive visualizations. This can help you interpret not just what people say, but how they feel while saying it.
What is an Emotion Graph?
An Emotion Graph is a visual representation of how emotions change over time during a video or audio interaction. Imentiv AI’s emotion graph maps facial expressions and vocal tone across three key factors: valence (positivity), arousal (energy), and intensity (strength).
How the Emotion Graph Works
The Emotion Graph is built on psychological foundations inspired by Plutchik’s Emotion Wheel and Russell’s Circumplex Model of Emotion. These frameworks provide a scientifically grounded view of human emotions.
When you upload a video, audio file, or text sample, the emotion AI processes the content, detecting emotions frame by frame, tone by tone, or sentence by sentence.
Depending on your chosen mode, the Emotion Graph adapts its visualization:
Video Mode
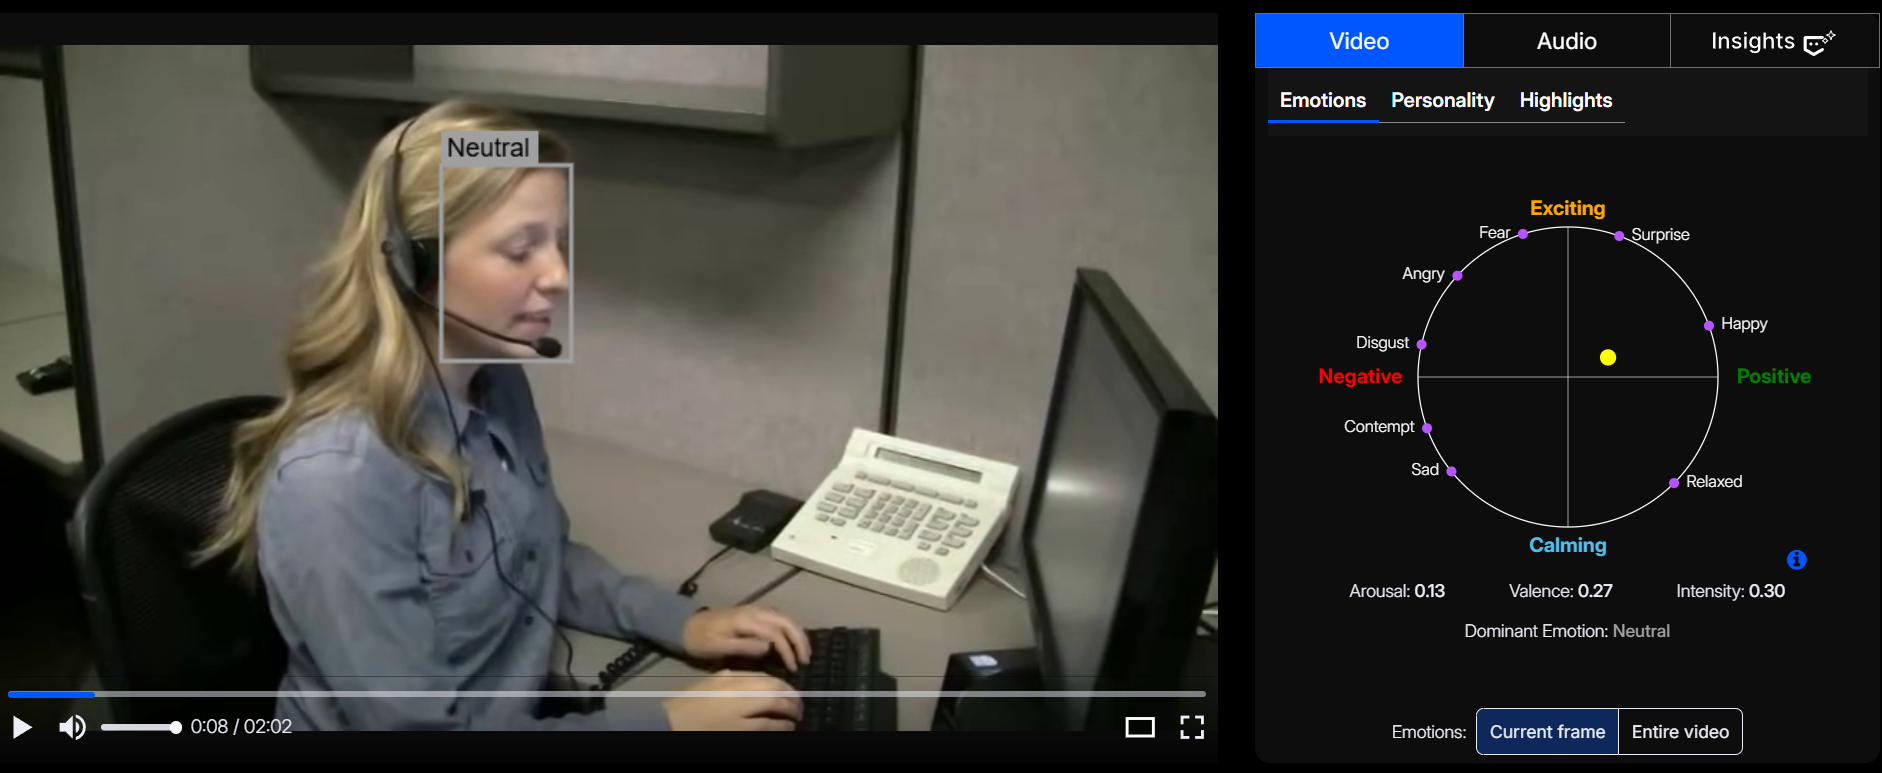
Analyzes facial expressions across frames to detect: Happy, Neutral, Angry, Surprise, Sad, Contempt, Fear, and Disgust.
But it goes beyond emotion labels. Each expression is also mapped along three psychological dimensions:
- Valence (positive ↔ negative feeling)
- Arousal (calm ↔ excited state)
- Intensity (strength of emotion)
Audio Mode
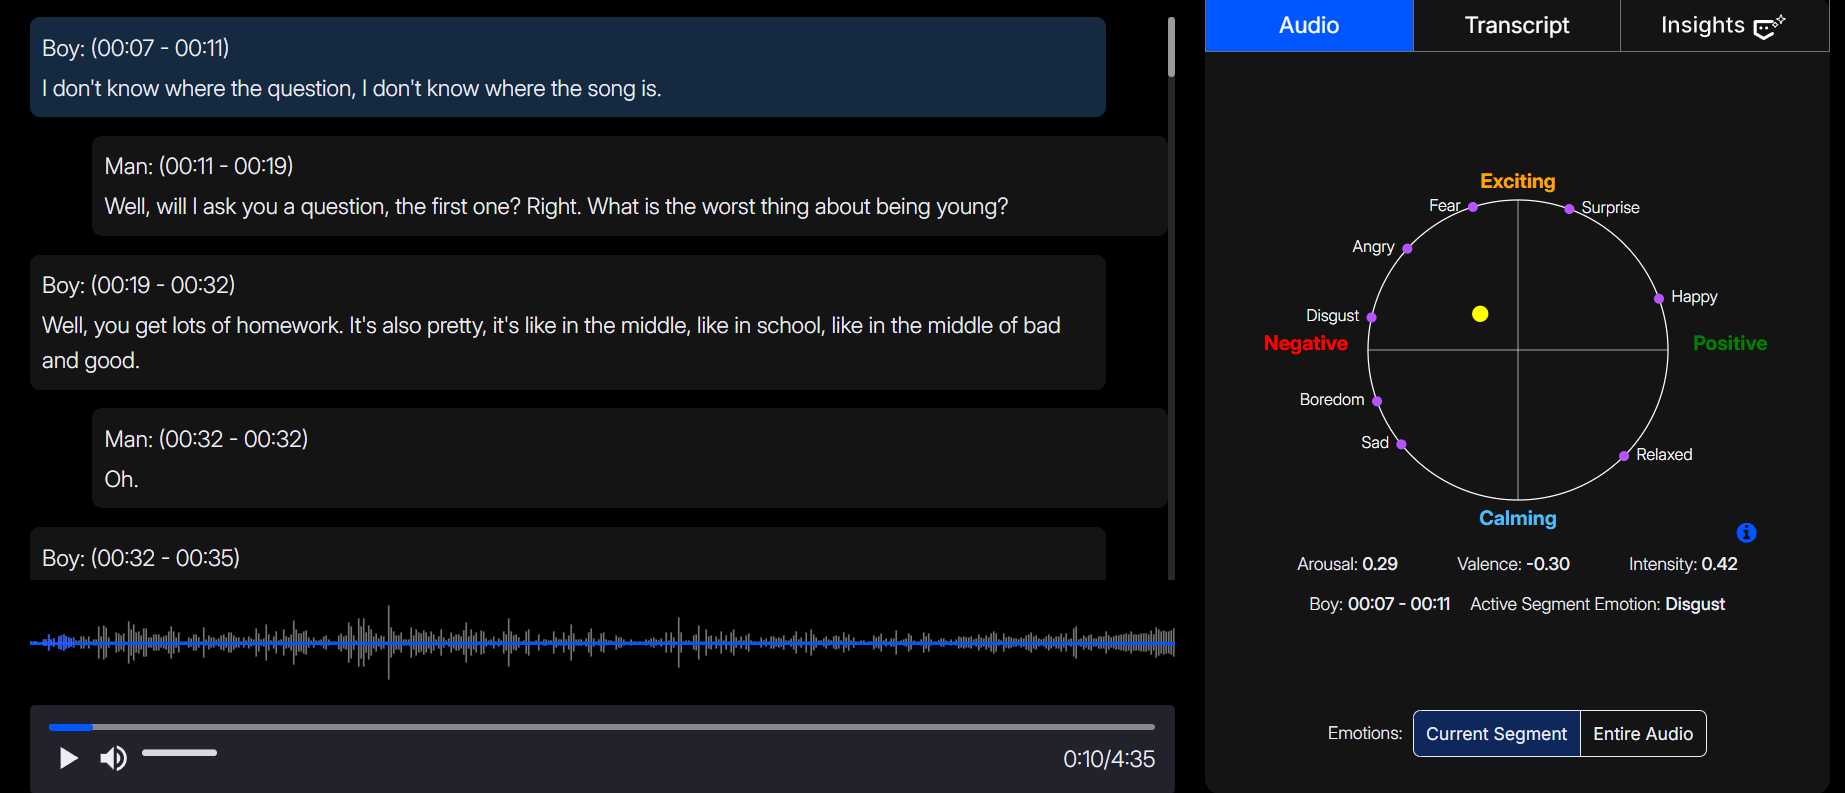
Reads emotional shifts through tone, pitch, and vocal modulation to identify: Neutral, Happy, Disgust, Fear, Surprise, Boredom, Sad, and Angry.
Each vocal segment is mapped not only by emotion type but also by its valence (positive–negative tone), arousal (energy or excitement level), and intensity (strength of emotion). This allows users to understand both what emotion was expressed and how strongly it was felt.
Users can switch seamlessly between video and audio graphs within the dashboard, enabling combined visual-vocal emotion analysis without reuploading content. You can also upload an audio file alone for standalone AI emotion detection.
Text Mode
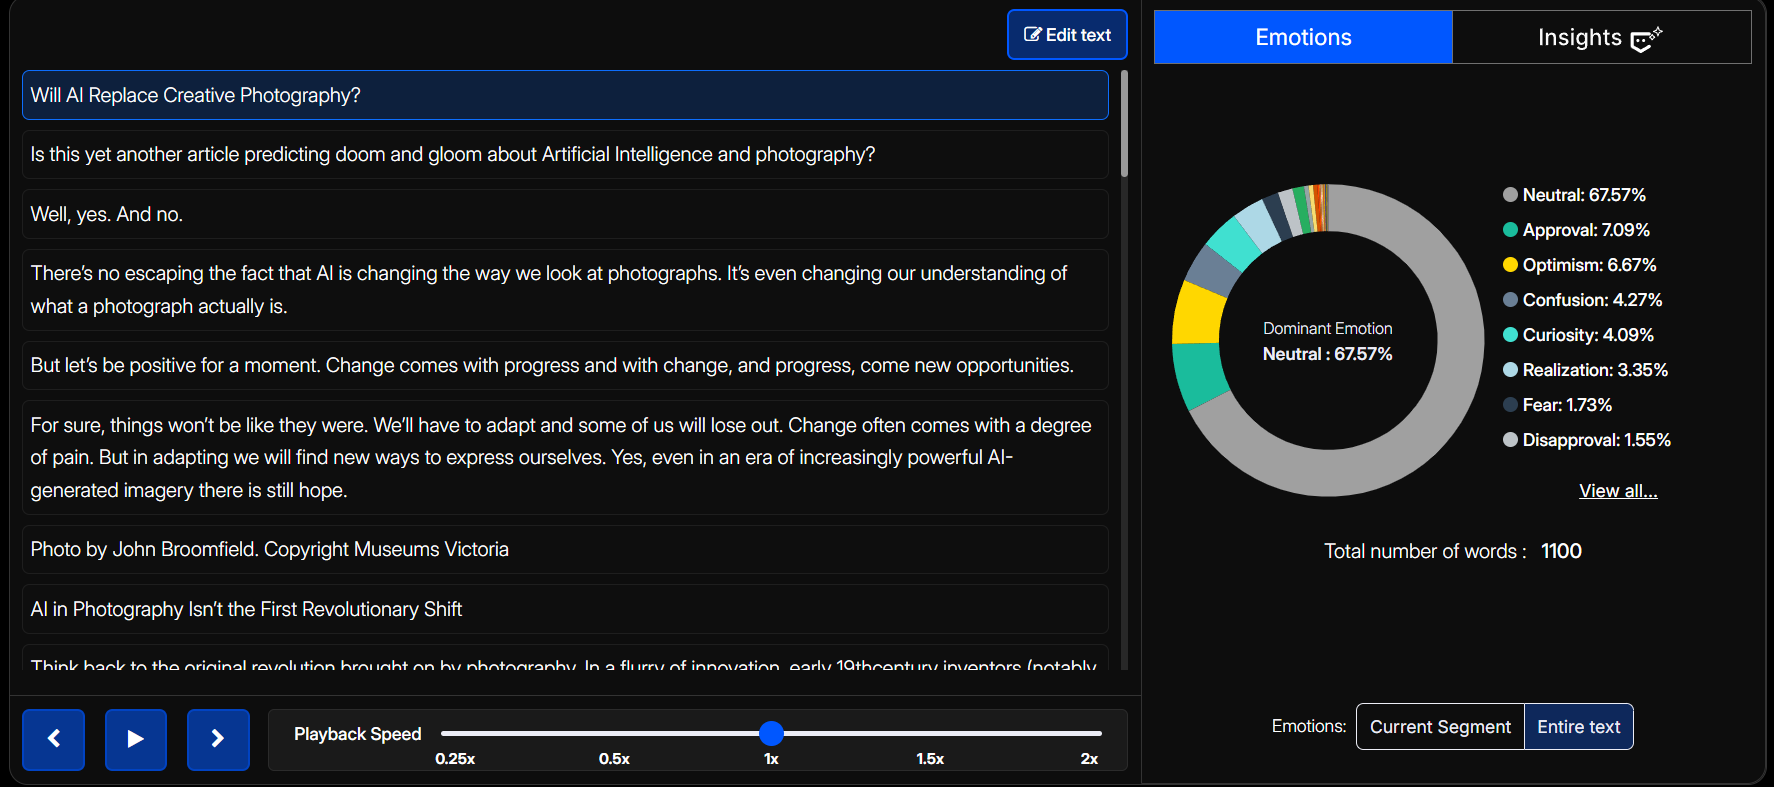
For written data such as chat logs, feedback, or transcripts, the Emotion Graph detects 28+ nuanced emotions, including gratitude, disappointment, curiosity, admiration, remorse, pride, optimism, confusion, sadness, and fear.
It plots these emotions across the text timeline, revealing emotional intensity patterns that are impossible to see through sentiment analysis alone.
Image Mode
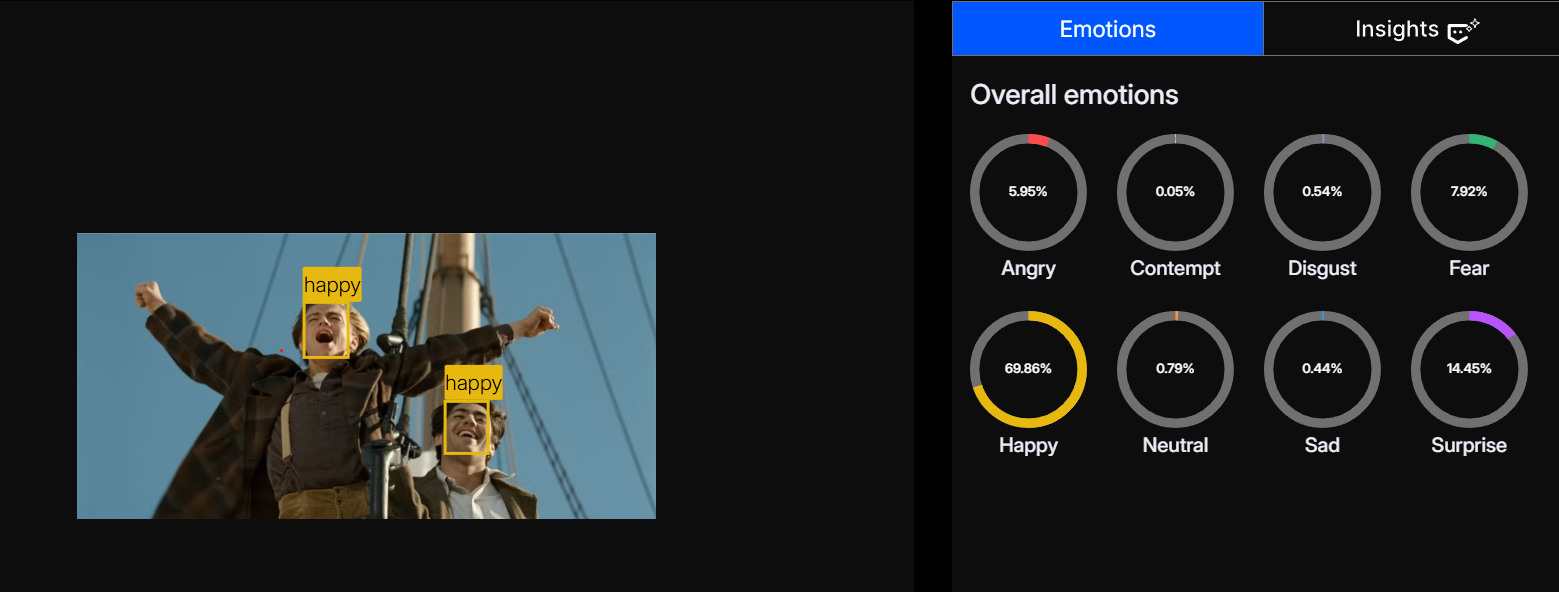
Analyzes still images to detect: Angry, Contempt, Disgust, Fear, Happy, Neutral, Sad, and Surprise.
This mode is especially useful in UX research, advertising, and HR contexts, where understanding emotional expression in a photo or team image can reveal mood, engagement, or stress levels.
Two Visualization Modes for Deeper Insight
1. Static Emotion Graph (Post-Processing Overview)
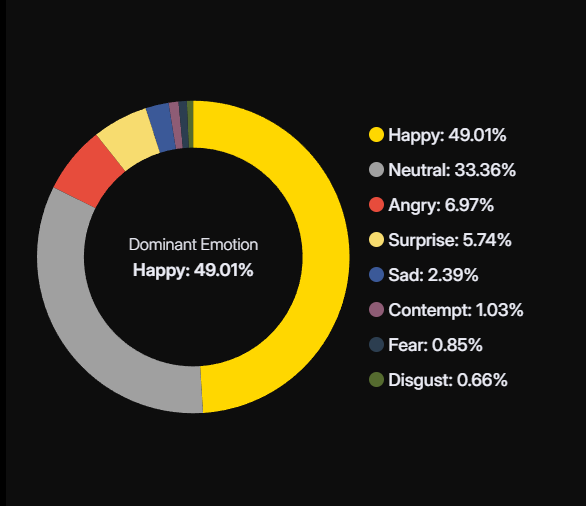
- Appears immediately after analysis.
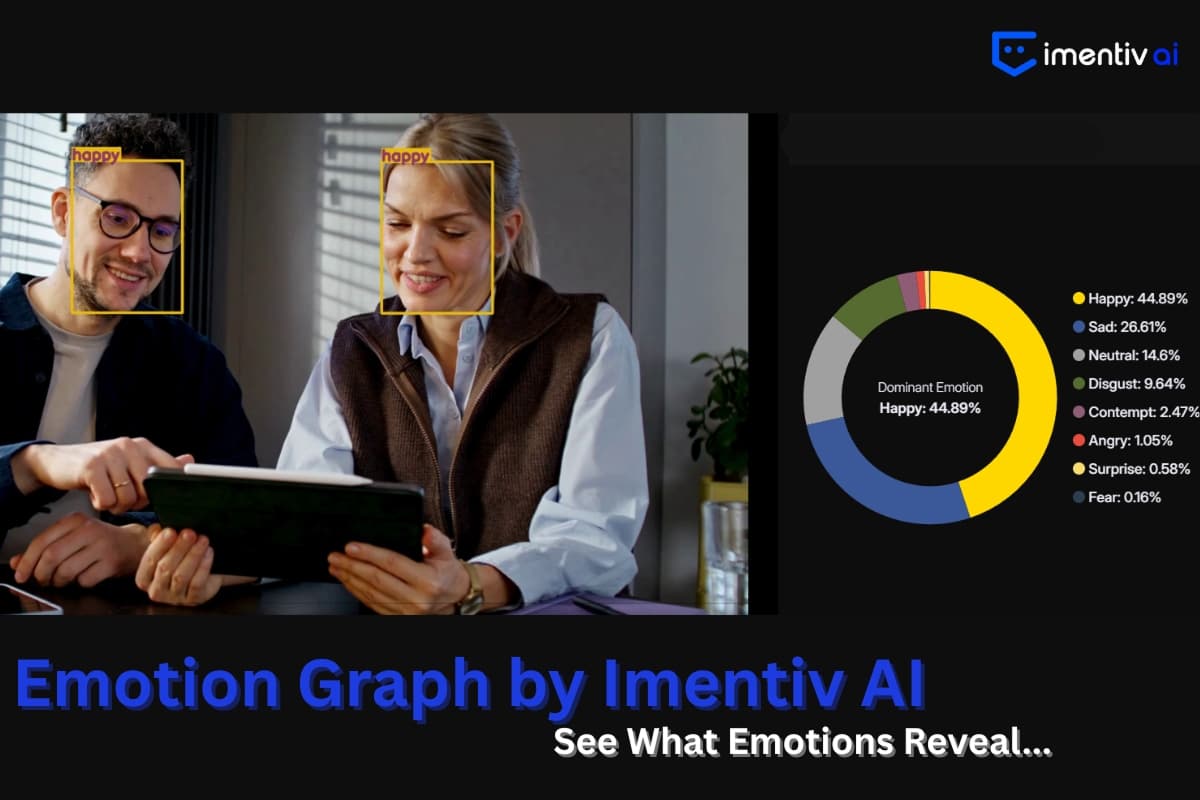
- Displays overall emotion distribution as a donut-style chart, with proportions adding up to 100%.
2. Dynamic Emotion Graph (Real-Time Emotional Movement)
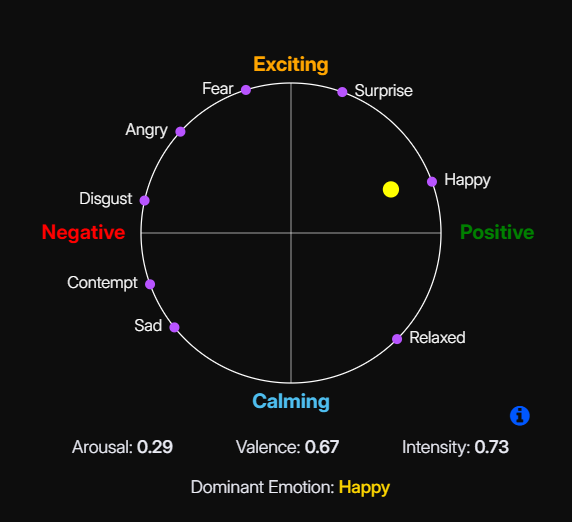
- A circular graph that integrates Valence (positive/negative) and Arousal (calm/excited).
- A moving yellow dot tracks emotions frame by frame (or segment by segment in audio).
- Even when paused, it freezes on the exact frame, providing an emotional snapshot for that moment. Together, these modes reveal both the overall tone and moment-to-moment shifts in emotional expression. This creates a multidimensional understanding of human behavior.
Why the Emotion Graph Matters
Leadership & Communication
HR & Recruitment
UX & Product Research
Understanding Emotions Through Data
See Emotion. Understand People.
With Imentiv AI’s Emotion Graph, emotions are no longer abstract. They’re visible, measurable, and meaningful.
Experience a new dimension of understanding, where data meets emotion.
Explore the Emotion Graph on Imentiv AI.