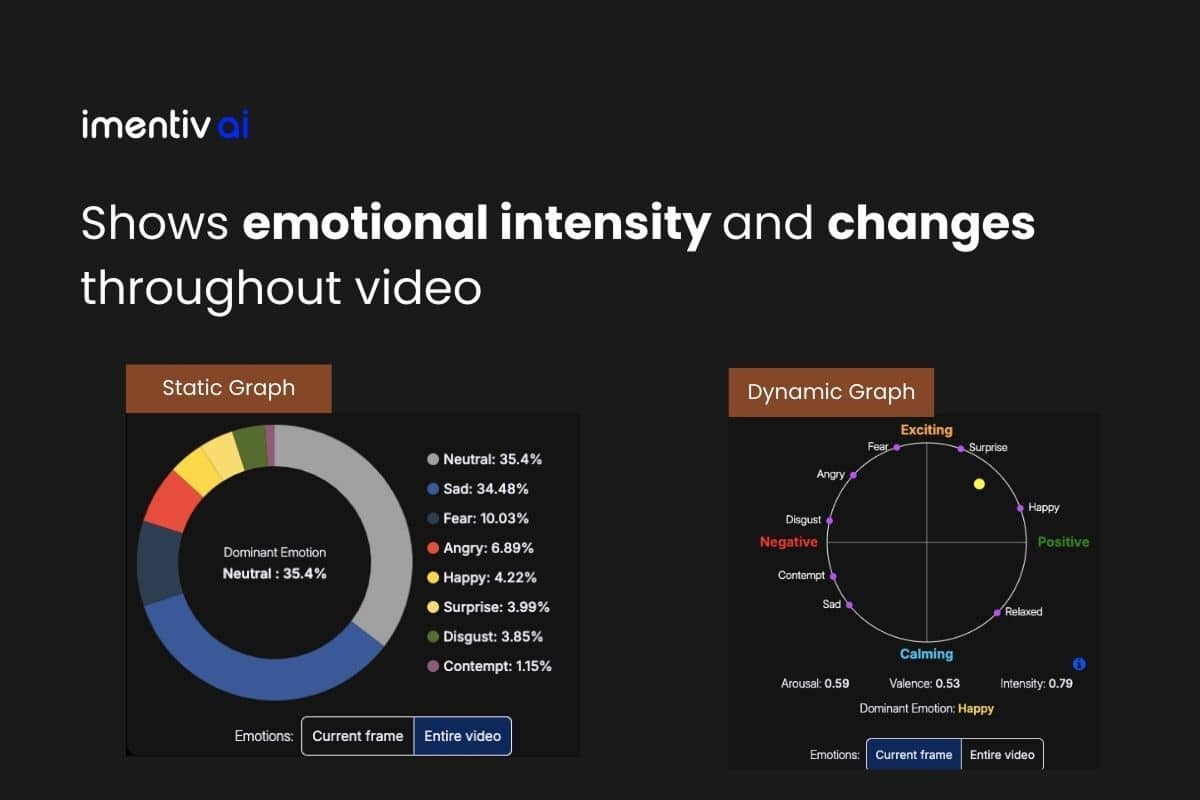
Emotion Graph
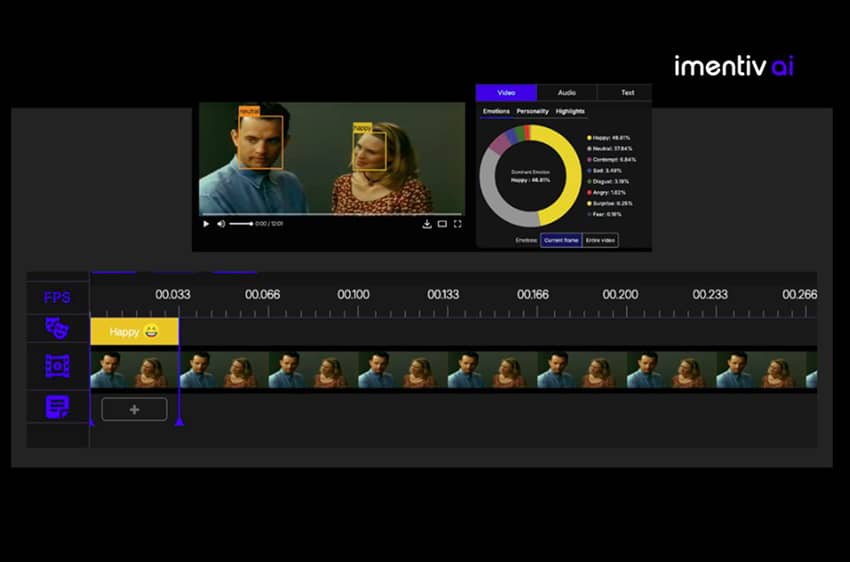
The Frame-by-Frame Emotion Analysis is one of the most powerful features of Imentiv’s Video Emotion Recognition platform. Our powerful emotion detection AI technology allows users to explore their video content in exceptional detail—tracking emotional changes moment-by-moment by analyzing each individual frame.
After uploading your video for processing through our advanced emotion detection AI system, you’ll access a comprehensive result dashboard showcasing multi-layered emotional patterns, personality insights, sentiment distribution, and detailed video emotion recognition metrics.
The dashboard offers a rich suite of insights—including Frame-by-Frame Emotion Analysis, which visualizes emotional content across every second.
Interactive Frame-by-Frame Timeline
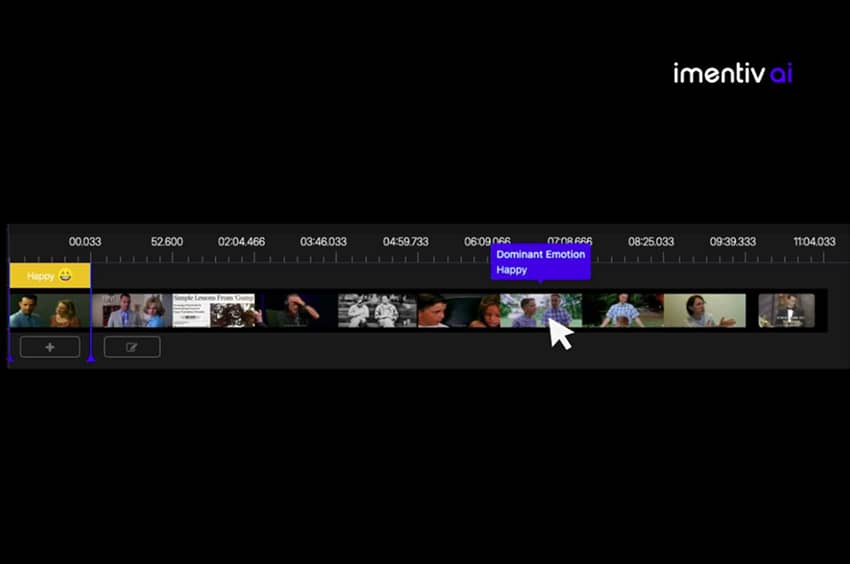
The Frame-by-Frame Emotion Analysis feature offers an interactive timeline of the video segmented into visual frames.
This lets you explore how emotions evolve second by second, without losing context.
Control Frame View with Zoom In and Out
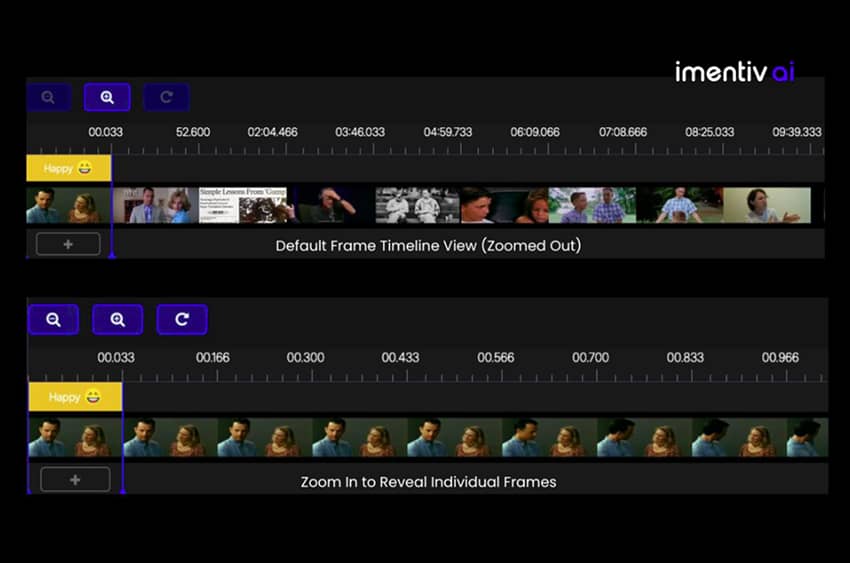
To explore specific sections more closely, click the Zoom In (magnifier-plus icon). As you zoom, the timeline gradually expands to reveal more frames per second, eventually reaching a level where every individual frame is visible—perfect for high-resolution emotional analysis.
You can also zoom out using the Zoom Out (magnifier-minus icon) to return to a broader timeline. This helps you alternate between micro and macro emotional perspectives, a useful flow for both creative editors and analysts.
Add Annotations to Each Frame
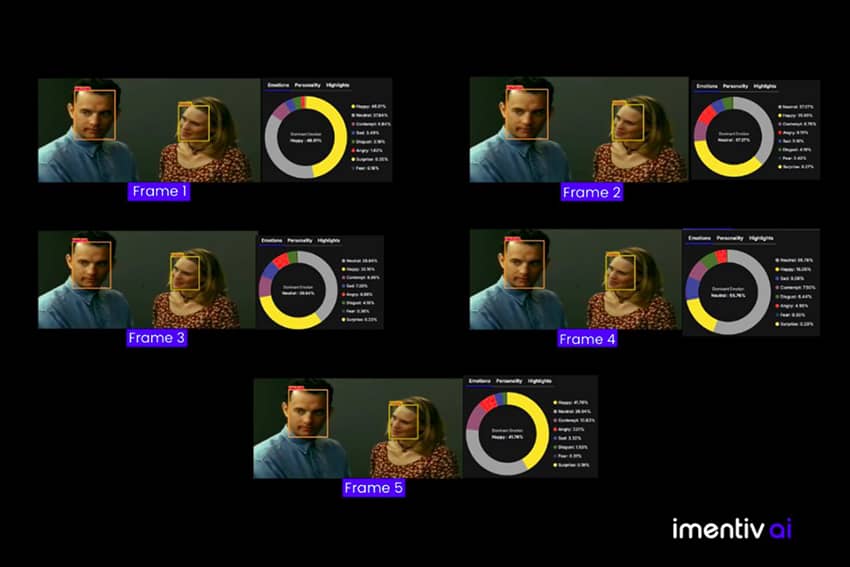
You can select any frame analyzed by our emotion detection AI and annotate it with personal notes, remarks, or observations. This makes the tool especially useful for researchers, editors, or reviewers aiming to document emotional shifts.
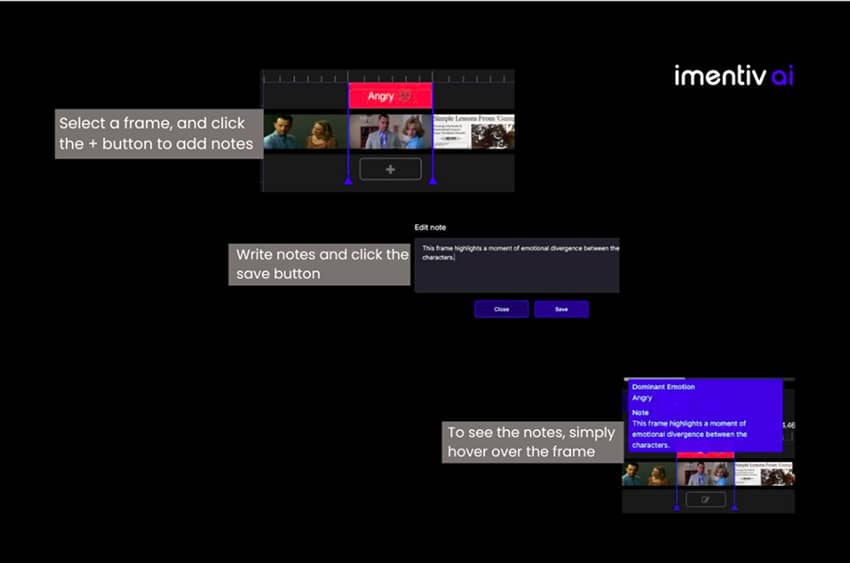
Hover Over Each Frame to View Emotions
As your mouse hovers over each frame, the dominant emotion detected in that exact moment appears as a quick pop-up or overlay. This means you can glide across the timeline to instantly scan for emotional variations—spotting bursts of joy, flickers of surprise, neutral pauses, or moments of tension without clicking anything.
What Frame-by-Frame Insights Do for Storytelling
Our Frame by Frame Emotion feature turns emotion analysis into a frame-accurate storytelling tool. It’s particularly powerful when evaluating:
- Micro-expressions and subtle emotional shifts in video content
- Key turning points in advertisements, speeches, or UX videos
- Moments that emotionally resonate with viewers—or fall flat
- Frame-specific comparisons across different audience versions
Experience Frame-by-Frame Emotion Detection AI in action
Read how Frame-by-Frame Analysis reveals emotional depth—real examples inside the blog
Learn about our Actor-by-Actor Face Emotion Recognition feature