.jpg?alt=media&token=2f367062-3d39-4193-b218-2a0eaa8e55ba&w=3840&q=75)
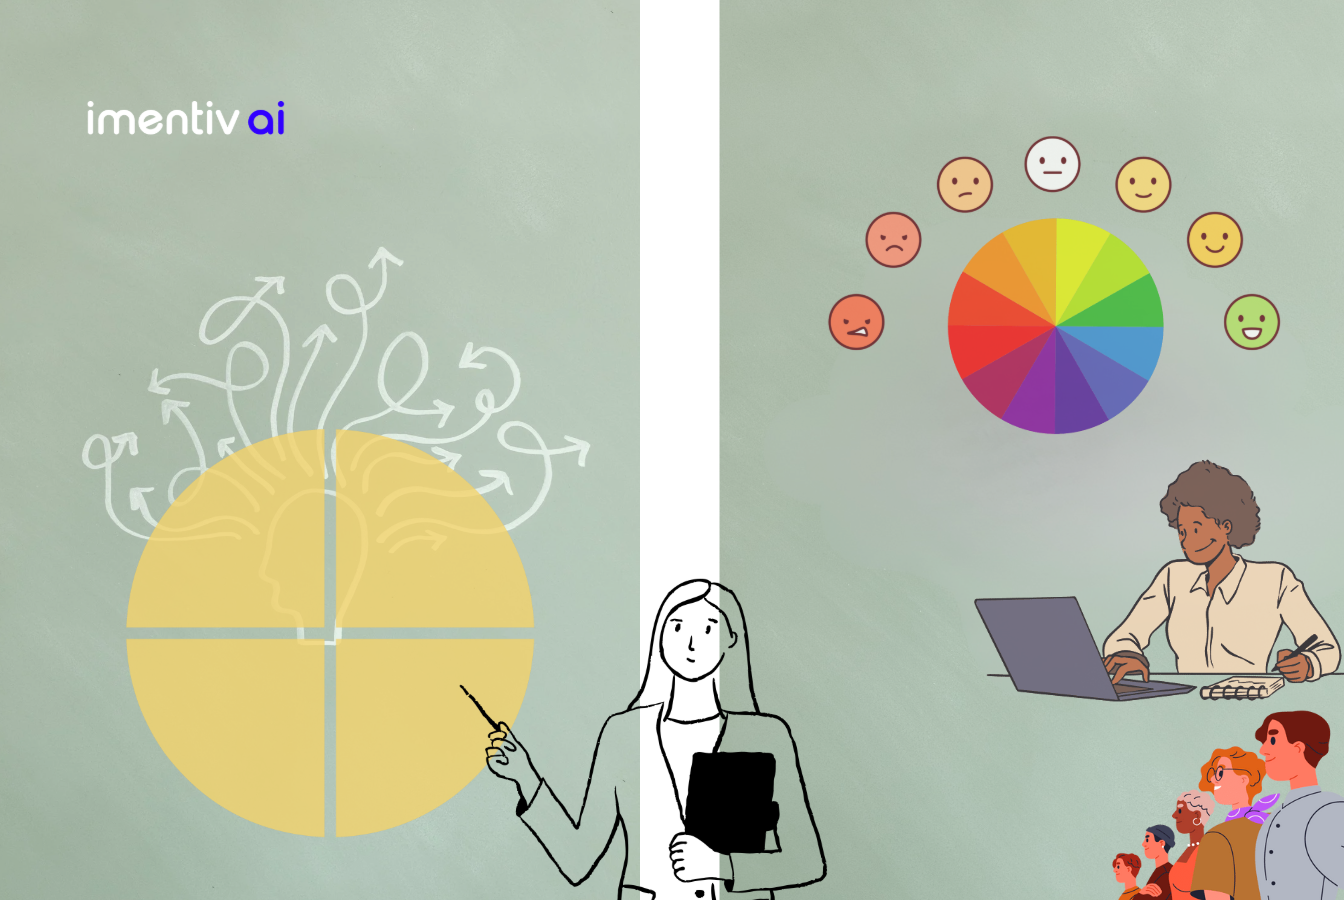
Emotion Graph: Real-Time Emotional Insights from Video & Audio
The Emotion Graph is Imentiv AI's core feature for visualizing emotional data from media. It provides a granular, continuous view of emotional dynamics, helping you measure authenticity, audience engagement, and overall emotional impact.
Imentiv AI Emotion Graph performs two functions. In video analysis, it tracks each person’s facial expressions, capturing emotions (e.g., happy, sad, angry) frame-by-frame . For audio analysis, it tracks each speaker’s vocal tone, capturing emotions (e.g., disgust, fear, sadness) segment-by-segment. It then delivers static summaries and real-time graphs of these emotional shifts.
Psychological Models Powering the Emotion Graph
Built on well-established psychological frameworks such as Plutchik’s Emotion Wheel and Russell’s Circumplex Model, the Emotion Graph reflects deep psychological insight.
We have integrated the Valence–Arousal framework at its core, enabling emotions to be mapped across two key dimensions — valence (pleasant to unpleasant) and arousal (calm to intense).
The resulting graph lets you continuously track how emotions shift over time across faces, voices, and speakers in each media segment.
What the Emotion Graph Represents?
The Emotion Graph captures precise, moment-by-moment emotional shifts, offering highly detailed insights.
When the media plays, the Emotion Graph turns interactive, acting like a dynamic emotion wheel in real time.
The interactive Emotion Wheel is divided into four quadrants representing core emotional categories.
The Emotion Graph is built on our in-house research and deep psychological guidance, ensuring highly accurate emotion analysis.
Structure : The wheel is defined by two perpendicular lines: the horizontal line represents valence (from negative to positive), and the vertical line represents arousal (from calm to excited).
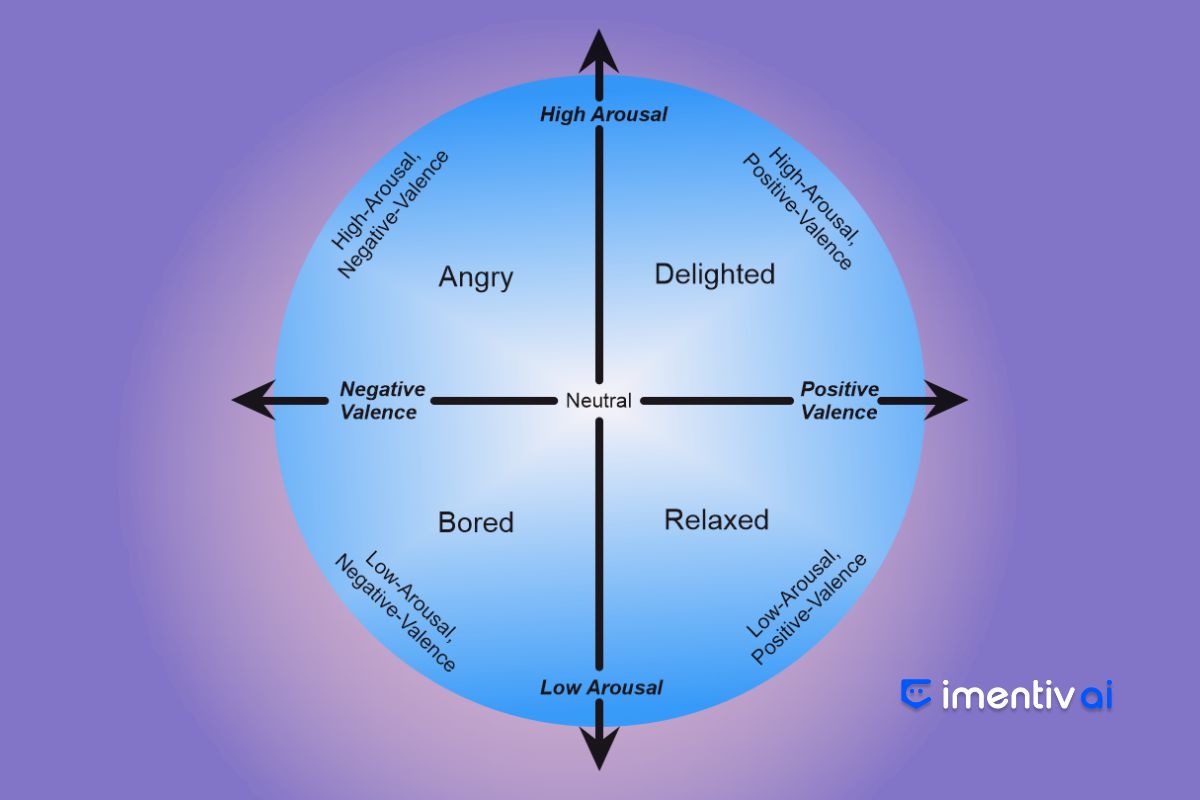
Mapping: Emotional categories are positioned on the wheel according to their valence and arousal values, providing a unified framework for both video and audio analysis.
Overview of Emotions at a Glance
Once your media is processed, you can explore the Emotion Graph on the dashboard — a static, donut-style visualization showing the full emotional makeup.
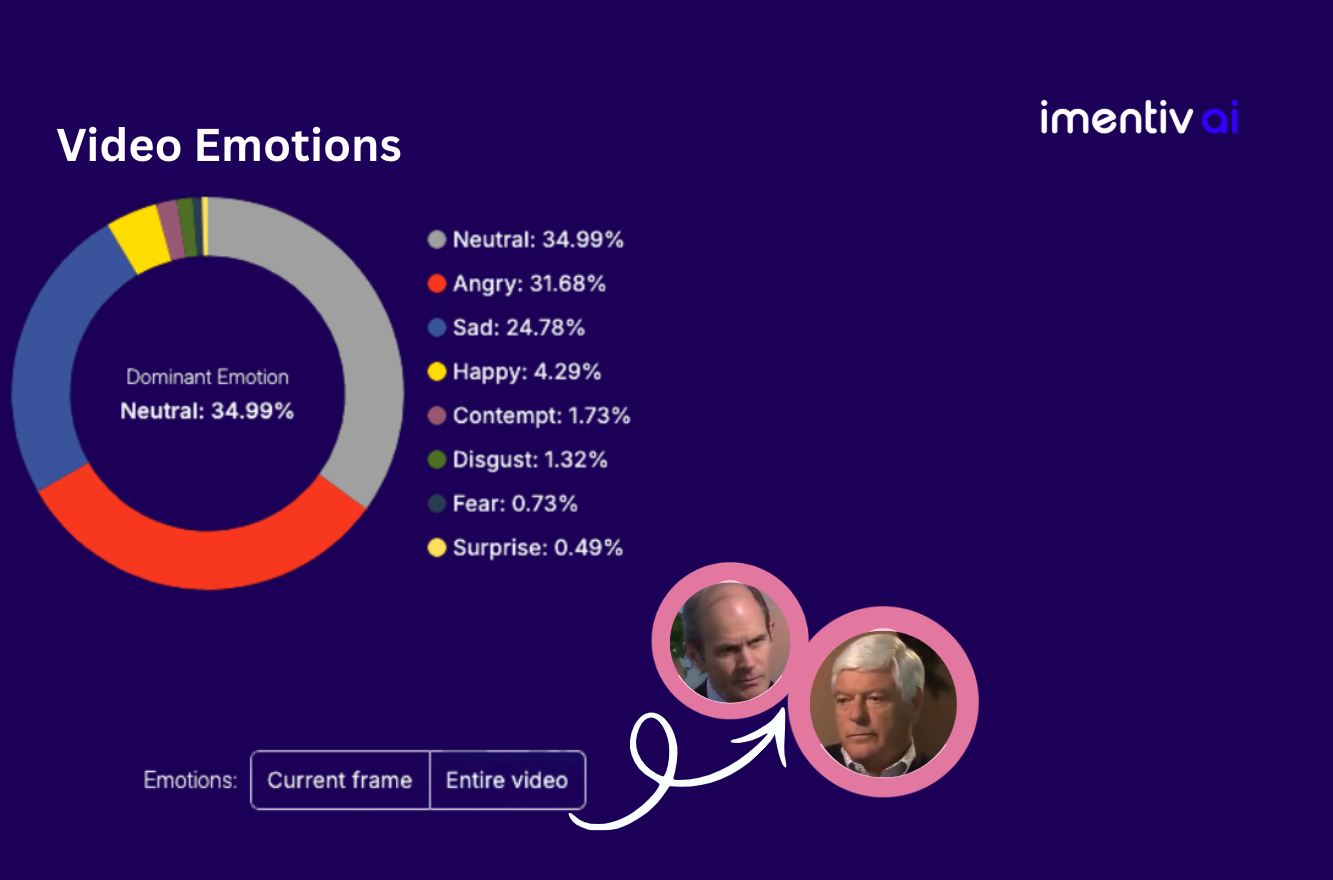
Shows the core emotions and their percentage values across the detected faces and frames throughout the entire video
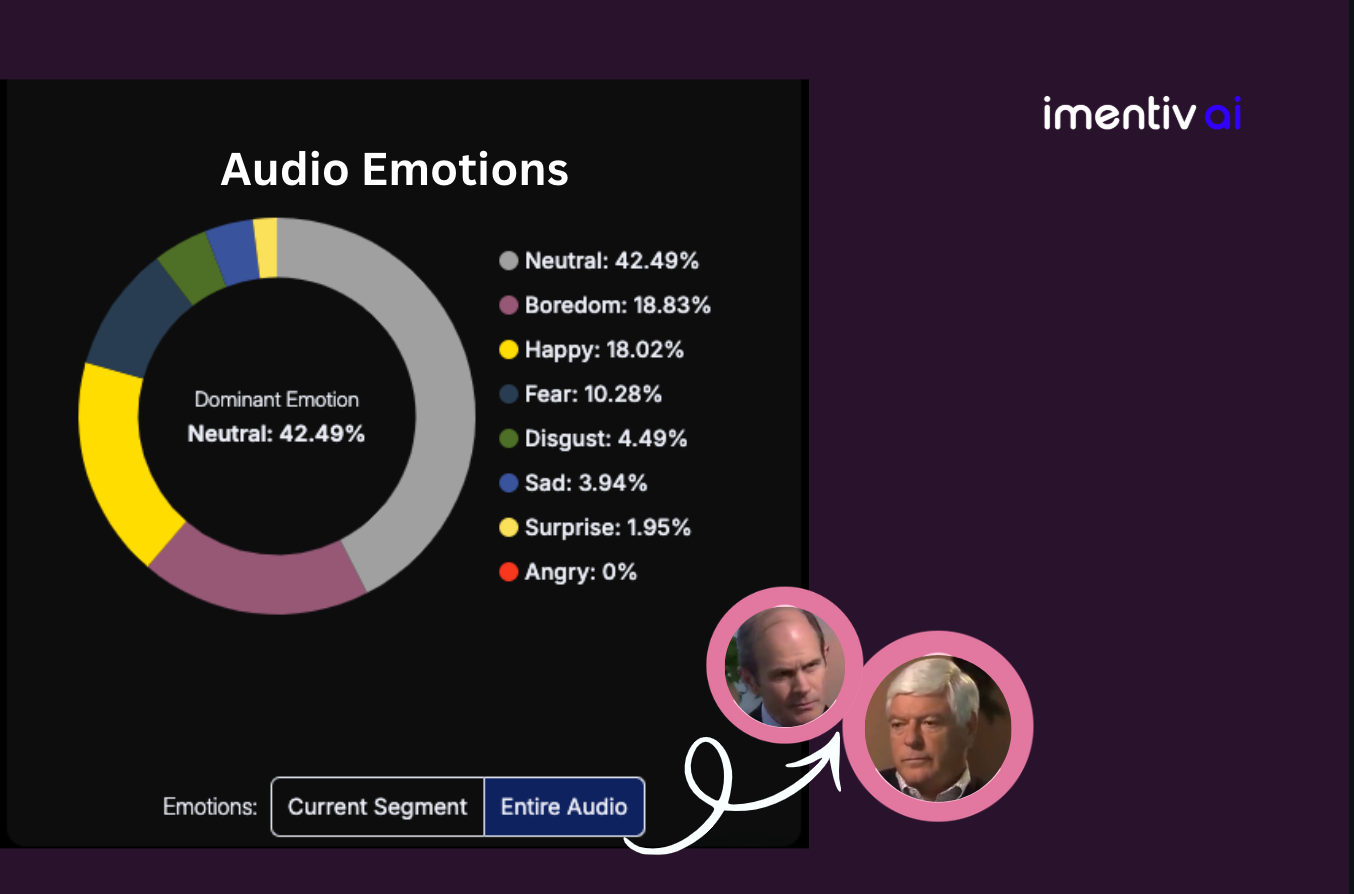
Shows the vocal emotion data, highlighting core emotions and their percentage values across the detected speakers and segments throughout the entire audio
You can see that each emotion in the Emotion Graph is assigned a unique color. Its value is shown as a percentage. This clearly highlights how much each emotion contributes to the overall composition.
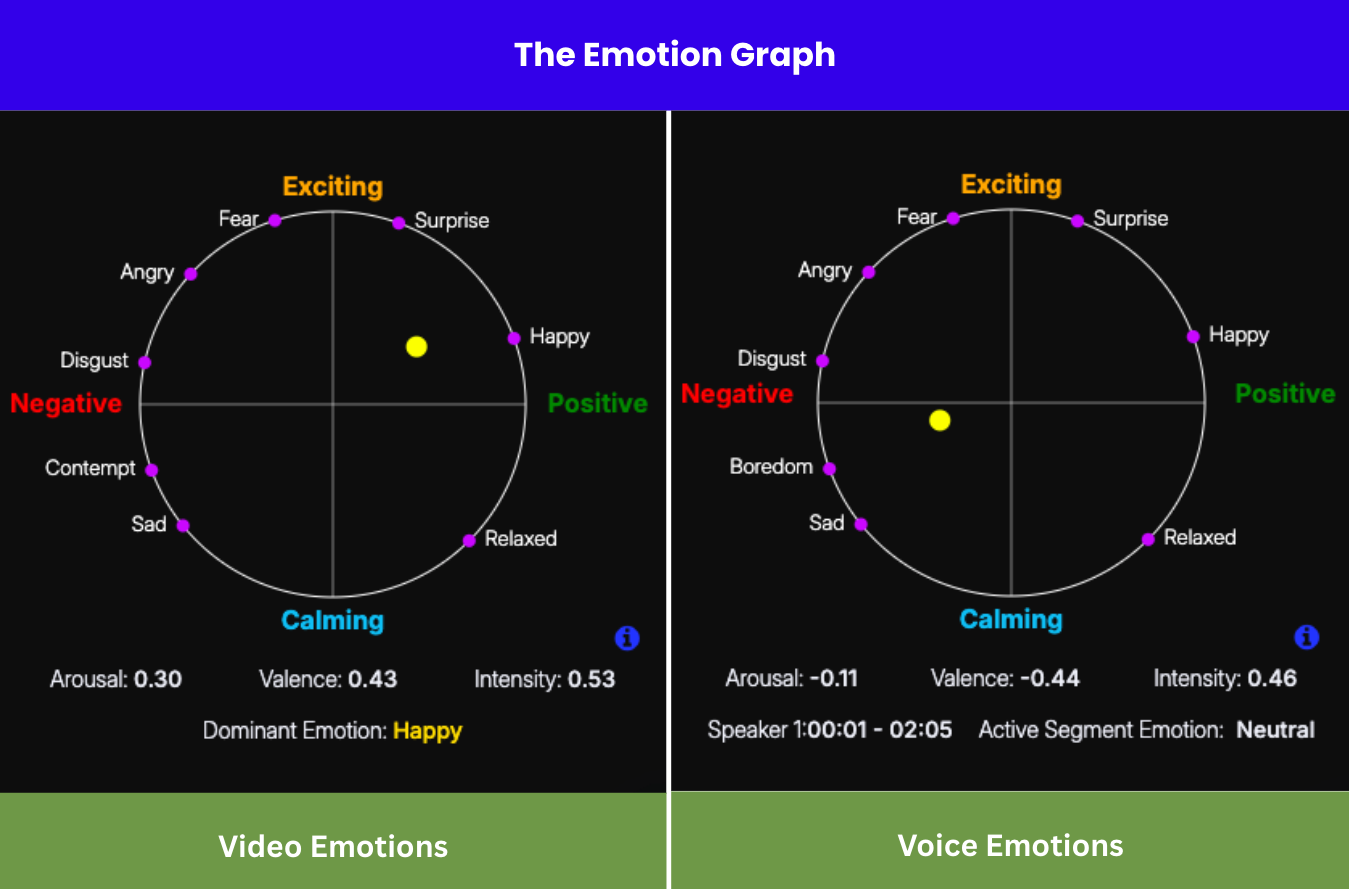
Real-Time Emotion Tracking
When you start playing the video/audio, the Emotion Graph transitions to its dynamic view. It reveals deep layers, showing how emotions shift across frames, and segments helping you trace emotional patterns as they evolve.
A yellow dot moves continuously across the wheel to represent the current emotional state of a person in the media. In video, the dot moves frame by frame; in audio, it moves across time segments.
The dot not only points to predefined emotion categories like happy or sad, but it can also appear anywhere within the emotion wheel based on the measured valence and arousal at that moment.
This movement makes the Emotion Graph feel alive, acting like a visual pulse of human emotion throughout the media.
For every video frame and audio segment, you can see detailed metrics such as dominant emotion, valence, arousal, and intensity scores. Together, these reveal how emotions rise, fall, and fluctuate across individuals and moments.
You can track emotions across the entire media or for each individual using the Emotion Graph. For example, during a panel discussion, it shows when a speaker’s tone rises from calm to assertive or when facial expressions shift from neutral to engaged.
Who Benefits from Emotion Graph Insights
The Emotion Graph helps creators, marketers, educators, HR teams, and researchers interpret emotional changes with precision. Users can either view these patterns in the visual graph or access the same frame-by-frame and segment-wise data through CSV exports or API integrations.
- Advertisers can map audience reactions in campaigns
- Educators can observe engagement across sessions
- HR professionals can assess confidence and authenticity in interviews
- Wellness experts can track emotional balance during sessions
- Researchers can examine emotional flow in conversations or media content
Whether it is visualized or analyzed through data, the Emotion Graph brings emotional understanding into measurable form.
Imentiv AI’s Emotion Graph provides a unified, granular view of emotions from media emotion analysis, helping users interpret patterns and make informed decisions based on observed emotional behavior.
Learn how to use our Emotion API to capture granular emotion data and integrate it into your workflow.